PDF formats of my Data Visualization Projects With Power BI
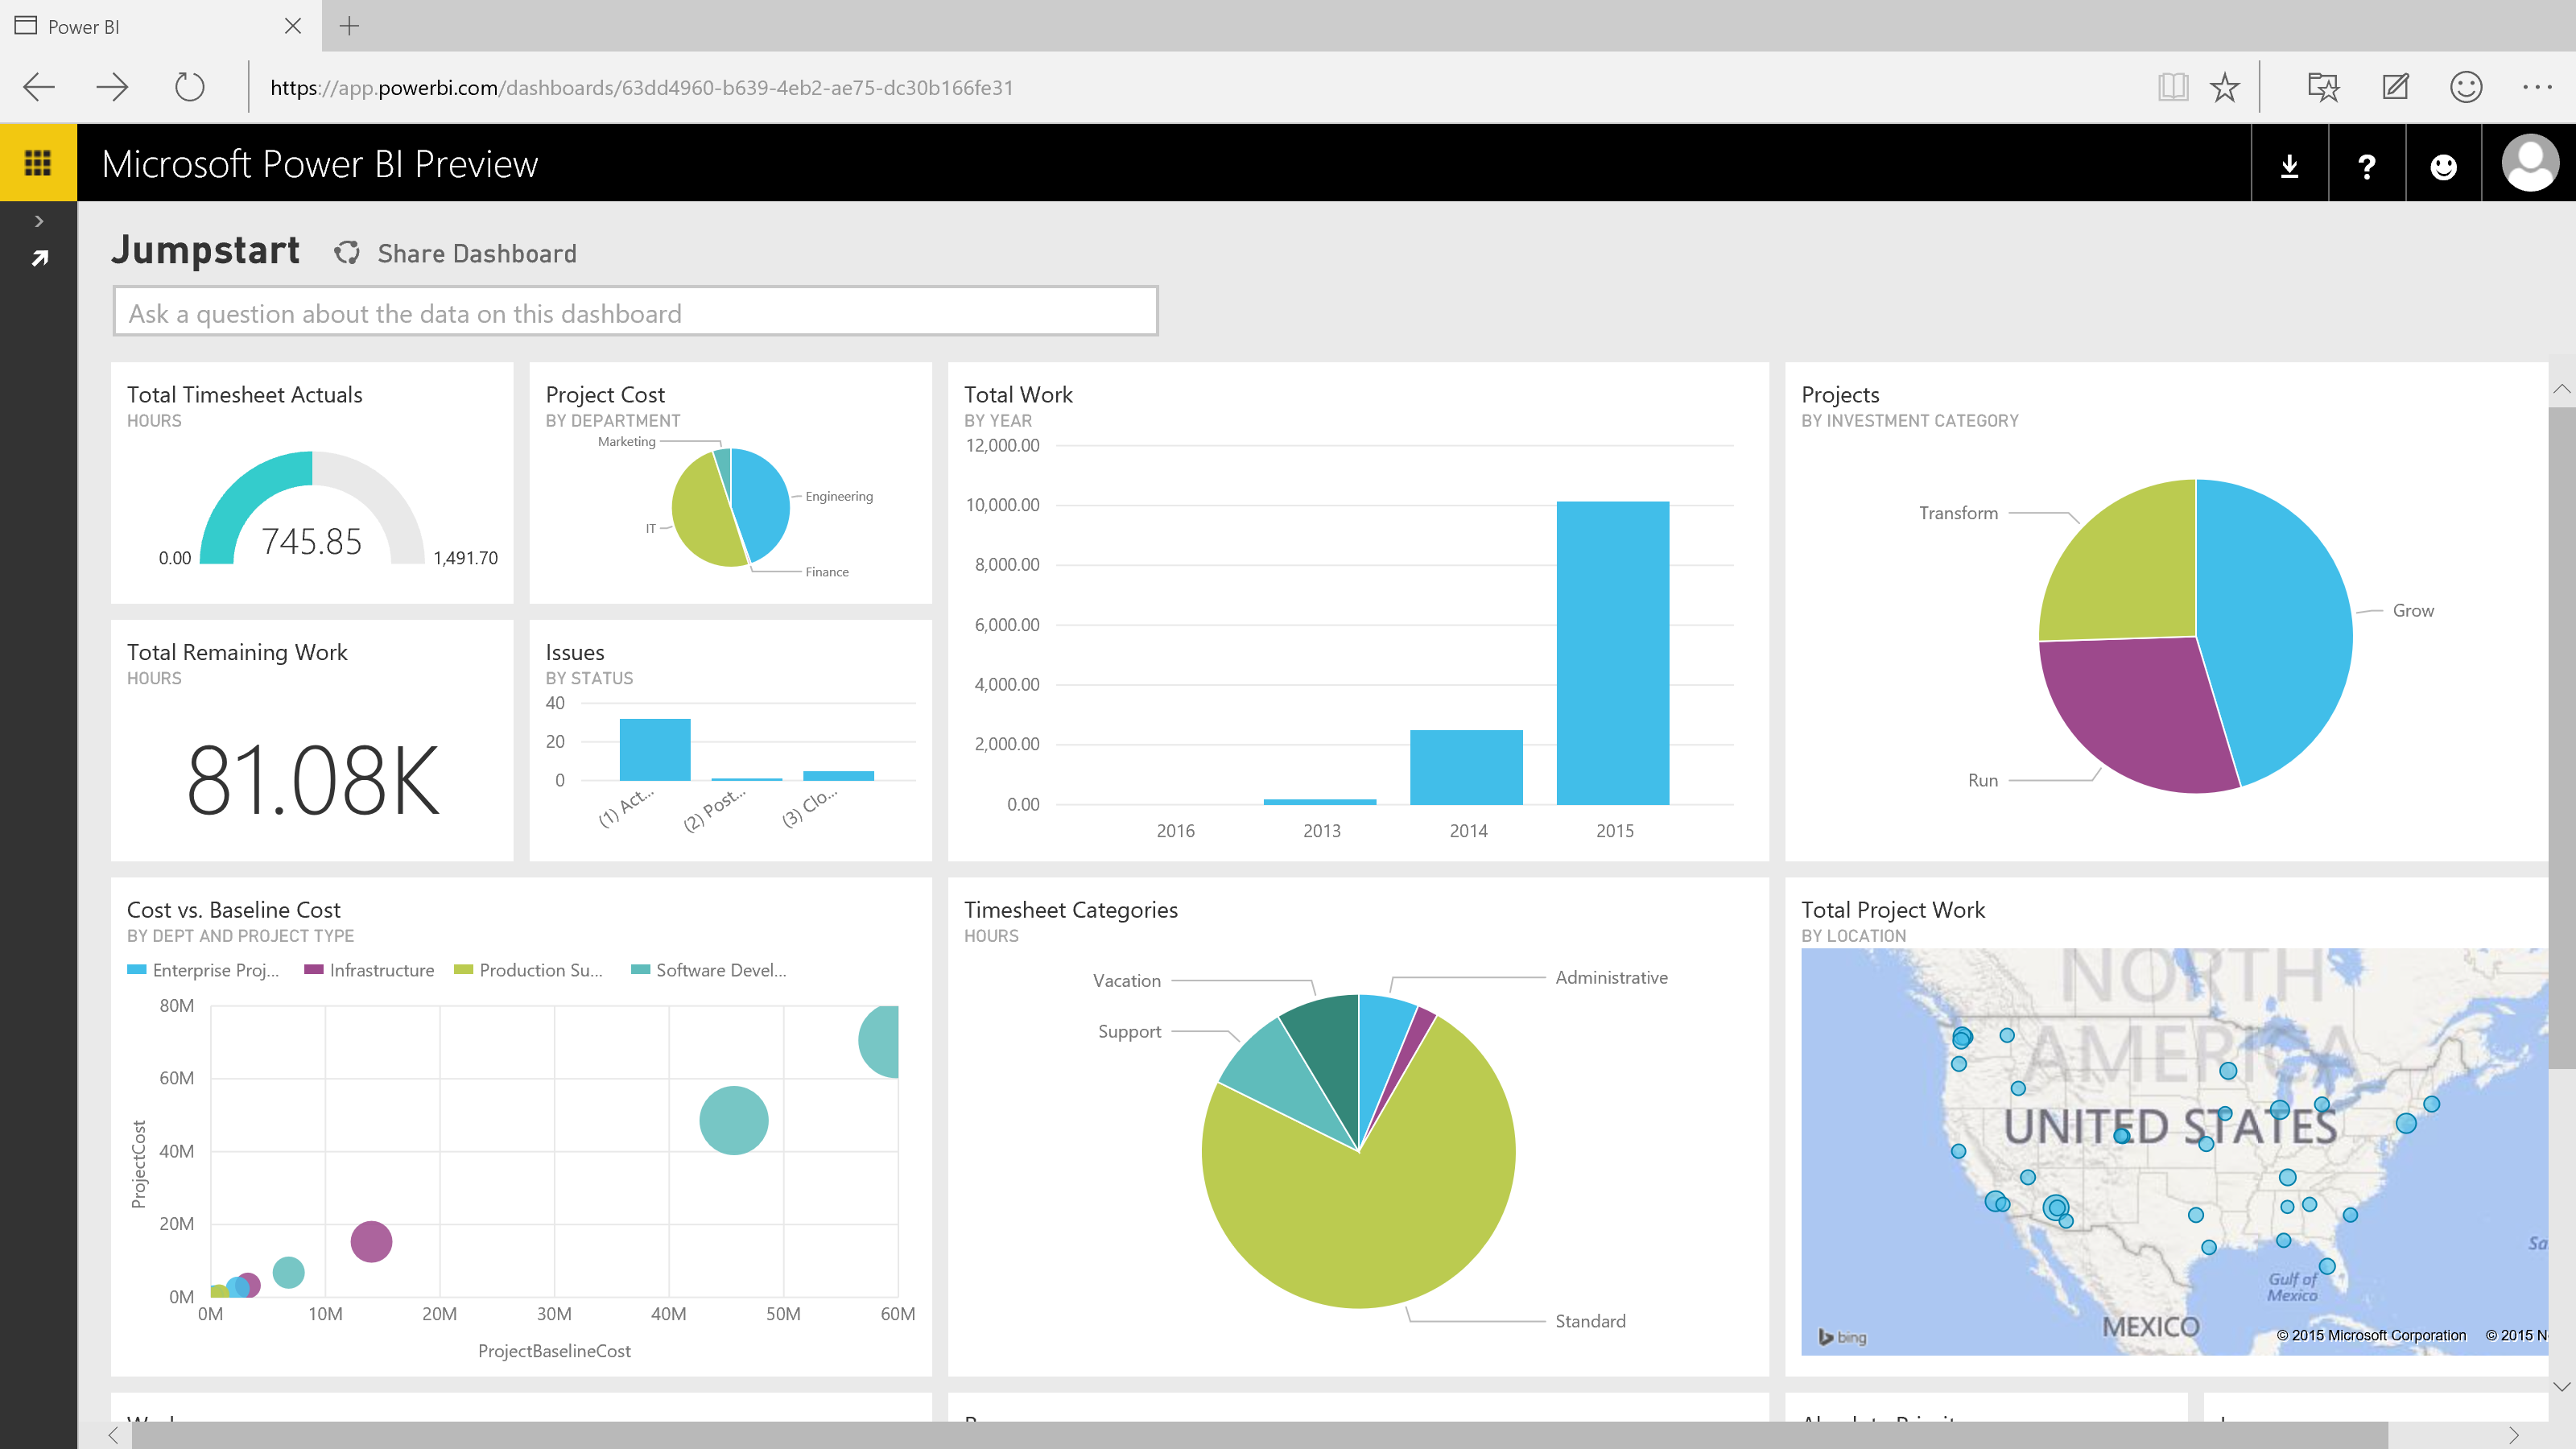
Power BI is a business intelligence tool that allows for data visualization and exploration. It provides interactive dashboards, reports, and charts, which can be used to analyze and present data in a meaningful way. Power BI allows users to connect to various data sources, including Excel spreadsheets, on-premises databases, and cloud-based data sources, and provides several built-in visualizations to choose from, including bar charts, line charts, pie charts, and maps. Additionally, users can customize the visualizations and create their own custom visuals. Power BI also offers collaboration and sharing features, so that data insights can be shared with others in the organization.